01 Aug 2022
Date: August 2022
2D in vitro assays do not reflect the tumor architecture and environment found in vivo, resulting in differences in the outcomes and pharmacological potencies of test agents being screened when comparing 2D in vitro versus in vivo models.
To provide a more reflective model of how tumor cells would respond to test agents in vivo, Labcorp and Predictive Oncology®® have co-developed tumor-specific 3D in vitro models that recapitulate tissue physiology and mimic the composition and architecture of both solid tumors and hematological malignancies. This tech spotlight highlights the characteristics of different reconstructed 3D models and their use as tools for in vitro screening of test agents. Here, we have compared responses of tumor cell lines to standard of care (SoC) agents in 2D, 3D and in vivo models.
Highlighted features1:
- The reconstructed extracellular matrix (ECM) allows for co-culture of tumor cells with mesenchymal stem cells (MSCs), fibroblasts, lymphoid, myeloid and CAR T-cells
- Cells can be isolated from the matrix after test agent exposure and analyzed by an appropriate downstream application, such as flow cytometry, RNASeq or in situ imaging; multiple endpoints can be measured in these in vitro assays
- Cytotoxicity assays such as CellTiter-Glo® can be performed in a high-throughput format with the successful development of both 96- and 384-well assay formats
- Multiple types of therapeutic agents can be screened in 3D models, including small molecules, biologics and CAR T-cells
3D reconstructed bone (r-Bone) matrix
The r-Bone matrix is a potential platform for studying multiple hematologic malignancies in vitro as well as for the investigation of solid tumor metastasis, like breast and prostate carcinomas to the bone matrix.
r-Bone 3D model shows similar architecture to human ex vivo tissue
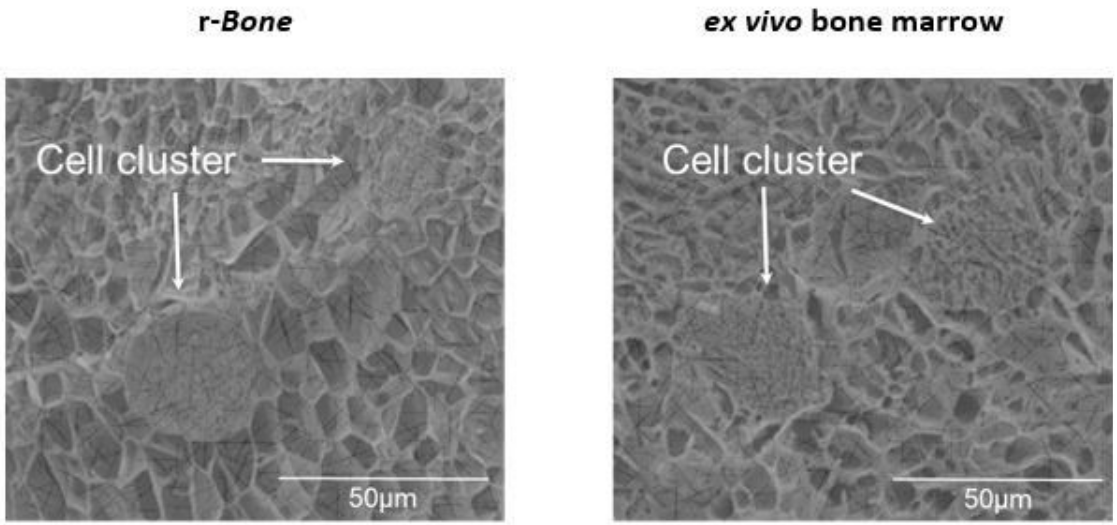
Figure 1: Cryo-electron microscopic images of r-Bone culture (left) and ex vivo (right) bone marrow seeded with metastatic breast cancer cells show that spatial and physical architecture of bone marrow stroma is maintained in the r-Bone ECM.
2D versus 3D cultures show variability in growth
In hematological malignancies, tumor cells commonly grow within the bone marrow; therefore, U266B1 human myeloma cells were cultured in r-Bone matrix and compared with 2D culture (growth media alone). While the 2D culture becomes quickly overgrown and the cells maintain a morphology characterized by a single cell suspension, the r-Bone 3D culture supports the development of cell aggregates, which proliferate into larger clusters more representative of tumor morphology. These cultures can be maintained for long periods with minor intervention by the researcher.
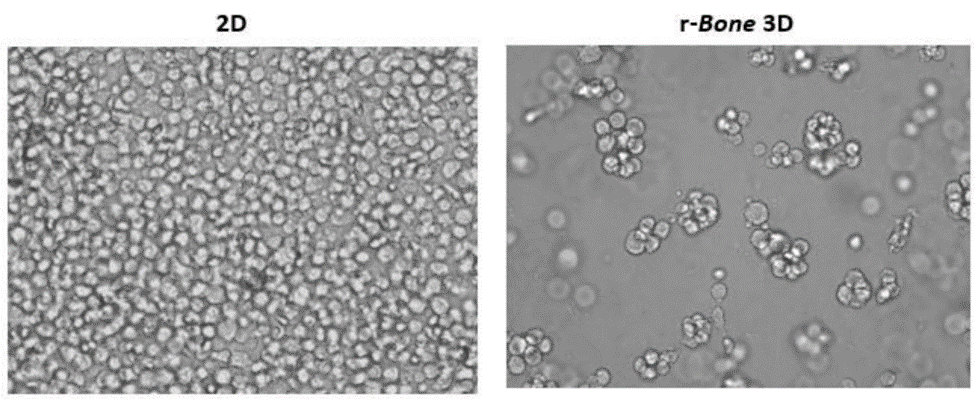
Figure 2: 2D versus r-Bone 3D culture of U266B1 human myeloma cells.
In vitro screening of bortezomib in 3D r-Bone matrix
Bortezomib is an SoC agent for the treatment of multiple myeloma.2 Myeloma cell lines NCI-H929, RPMI 8226 and U266B1 cells were cultured in r-Bone for four days and treated with bortezomib for an additional four days to assess inhibition of cell proliferation using cytotoxicity assays such as CellTiter-Glo®. The r-Bone matrix supports the growth and maintenance of multiple myeloma cells and allows for screening of test agents in vitro in a bone-marrow-like microenvironment.

Figure 3: Bortezomib inhibition of myeloma cell proliferation in r-Bone culture. (A) CellTiter-Glo reagent was added and luminescence was quantified using a Cytation 3 imaging plate reader (BioTek Instruments). Four-parameter nonlinear curve-fitting analysis was normalized against the vehicle-treated wells (n = 3 wells per concentration).
(B) Representative images of U266B1 cells in r-Bone culture treated with vehicle (0.5% DMSO) or 20 nM bortezomib. The red arrows indicate dead or dying cells in the cell clusters after 72-hour exposure.
Cytotoxicity analysis of U266B1 cells cultured in 2D, in 3D r-Bone matrix, and co-cultured with MSCs in 3D r-Bone matrix was done to assess cell viability after treatment with bortezomib. The r-Bone matrix supports the co-culture of multiple myeloma cells and stromal cells, creating a more physiologic environment. Co-culture with stem cells did not alter the effect of bortezomib in the 3D multiple myeloma culture.

Figure 4: CellTiter-Glo analysis for bortezomib against U266B1 cells in 2D, 3D r-Bone matrix and 3D r-Bone matrix co-cultured with MSCs
3D reconstructed solid tumor matrices
Response to SoC drugs in 3D cultures correlates with in vivo models3
Human breast tumor models
Human MDA-MB-231 breast cancer cells were implanted subcutaneously into the right axilla of female nude mice (Envigo) and SoC agents were administered as indicated. In vivo responses with serial dosing of SoC agents were compared with in vitro responses from single-dose treatment of MDA-MB-231 cells grown in 2D and 3D reconstructed breast (r-Breast) cultures. The MDA-MB-231 cells were sensitive to paclitaxel both in 2D and in the 3D r-Breast as well as in vivo, with complete growth inhibition at the dose of 10 mg/kg (not shown) and 15 mg/kg. Variability was observed in the pharmacological potencies of the SoC drugs in 2D versus 3D r-Breast cultures.
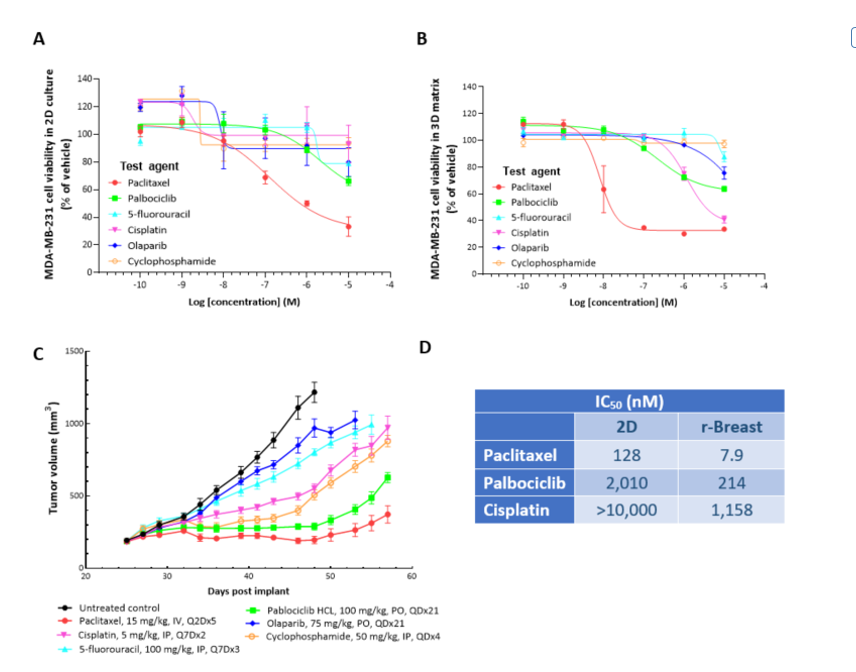
Figure 5: CellTiter-Glo® analysis for SoC agents against MDA-MB-231 cells in 2D (A), 3D r-Breast matrix (B) and in vivo response in NSG mice (C) is shown. The 3D response for all the tested compounds compares to the in vivo response. The IC50 values for the 2D and 3D are shown in the table (D).
Mouse breast tumor models
Murine 4T1-Luc2-1A4 breast cancer cells were implanted subcutaneously into the right axilla of female Balb/c nude mice and paclitaxel was administered as indicated. In vivo responses with serial dosing of paclitaxel were compared with in vitro responses from single-dose treatment of 4T1-Luc2-1A4 cells grown in 2D and 3D reconstructed mouse breast (r-mBreast) cultures and ex vivo mouse tumor suspension in 3D r-mBreast matrix.
Paclitaxel was cytotoxic in 2D cultures of 4T1-Luc2-1A4 cells (IC50 = 59 nM), but not in the r-mBreast model or in vivo, where the syngeneic 4T1 model was refractory to paclitaxel at 10 mg/kg and 15 mg/kg (not shown). In addition, similar pharmacological potencies were observed in 4T1-Luc2-1A4 cells versus ex vivo tumor suspension in 3D r-mBreast matrix. The response to SoC treatment in 3D r-mBreast culture was therefore more reflective of in vivo response than that in the 2D culture.
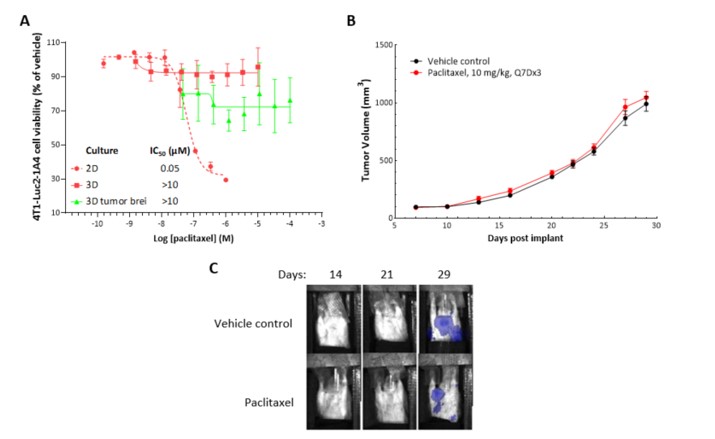
Figure 6: CellTiter-Glo® analysis for paclitaxel (A) against murine breast cancer 4T1-Luc2-1A4 cells in 2D, in 3D r-mBreast matrix and with tumor cell suspension is shown. Paclitaxel treatment in 2D shows cytotoxicity, but in r-mBreast 3D matrix when cells or tumor suspension is used, there is minimal cytotoxic effect. In vivo, treatment with paclitaxel as a single agent shows to be ineffective in decreasing 4T1 tumor growth in Balb/c mice (B). Shielded bioluminescence imaging of animals shows metastasis of 4T1-Luc2-1A4 tumors to the lungs (C).
Human non-small cell lung cancer (NSCLC) models
Human NCI-H460 NSCLC cells were implanted subcutaneously into the right axilla of female nude mice and SoC agents were administered as indicated. In vivo responses with serial dosing of SoC agents were compared with in vitro responses from single-dose treatment of NCI-H460 cells grown in 2D and 3D reconstructed lung (r-Lung) cultures. r-Lung models show similar architecture to human ex vivo lung tissue and their responses to SoC drugs correlate as well. The NCI-H460 cells were sensitive to paclitaxel in 2D (IC50 = 2.3 nM), while minimal response was seen in the 3D r-Lung model; in vivo, there was minimal response seen at 20 mg/kg treatment. These same cells were refractory to erlotinib in 2D, 3D and in vivo.
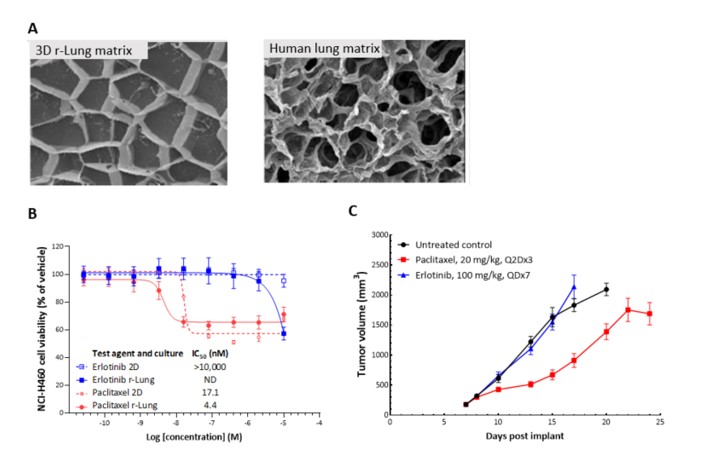
Figure 7: Cryo-electron microscopic images of 3D r-Lung matrix (left) and human lung matrix (right) show similar architecture (A). CellTiter-Glo analysis of paclitaxel and erlotinib cytotoxicity on NCI-H460 human NSCLC cells assayed in 2D and 3D (B) and in vivo tumor burden (C). Paclitaxel treatment of NCI-H460 in 2D and 3D r-Lung (B) showed similar cytotoxic effects that were also recapitulated in the in vivo tumors in female nude mice (C). Erlotinib in 2D had no cytotoxic effect at the tested concentration and, in 3D on r-Lung matrix, had a cytotoxic effect at a higher concentration. In vivo, erlotinib at 100 mg/kg did not show much of a response; however, two of 10 mice exited the study due to body weight loss >20%. Control animals on the other hand showed progressive body weight increase with tumor progression. ND = not determined.
Taken together, these data demonstrate that Predictive Oncology® organ-specific 3D models mimic in vivo response with a higher fidelity than the standard 2D cultures and are therefore more predictive and relevant at the same time.
The variability of IC50 values observed in 2D and 3D cultures could be a result of differences in experimental setup in terms of tumor architecture, microenvironment, cell confluency, senescence and exposure to available drugs in the media. Considering the similarities observed in 3D cell culture versus ex vivo tumor suspension, these factors should be considered when relying on the pharmacological potencies observed in vitro to plan in vivo toxicity studies.
Predictive Oncology® has provided customized tumor-specific 3D cell culture models since 2014 and has been actively developing numerous organ-specific matrices to broaden the preclinical tumor offerings since Labcorp and Predictive Oncology® have been working together. Labcorp is now offering human and exclusively developed mouse 3D models in collaboration with Predictive Oncology® with the goal of providing faster and more predictive in vivo results. Additional SoC agents are being profiled in these and other models.
While 2D in vitro assays have been preferred for screening efforts of chemical libraries so far, mainly because of cost, these results show that the Predictive Oncology® 3D culture models could lead to reduction in the number of animals used for preclinical testing and provide an early opportunity to identify test agents that may survive in the drug development pipeline.
To begin a discussion about your next project, contact the scientists on Labcorp Drug Development’s Preclinical Oncology team.
Note: Please note that all animal care and use was conducted according to animal welfare regulations in an AAALAC-accredited facility with IACUC protocol review and approval.
