Poster
MDA-MB-231-luc-D3H2LN: A valuable model for triple-negative breast cancer research
One of these models is the MDA-MB-231 human breast adenocarcinoma cell line; which was derived from a metastatic site in a 51 year old Caucasian woman. This model has proven to be very valuable to the cancer research community. Clones of the parental line (MDA-MB-231) have been generated and optimized to reliably and spontaneously metastasize to the lungs and lymph nodes when implanted orthotopically. The orthotopic implant allows the natural and more clinically relevant process of metastasis to occur.
The spontaneously metastasizing clonal line, MDA-MB-231-luc-D3H2LN has also been transfected with luciferase; which allows researchers to locate and monitor distal metastatic disease. This model enables our client with the ability to evaluate the impact that their test material has on the primary orthotopic tumor, as well as, the metastatic process using optical imaging with bioluminescence (BLI). We have validated MDA-MB-231-luc-D3H2LN as a spontaneous metastatic model when implanted in the mammary fat pad.
The graphs (Figures 1 and 2) below show the primary tumor growth (traditional caliper measurements) and the progression of metastatic disease to the lymph nodes (BLI signal measured in photons/sec). The BLI images (Figure 3) show the progression of metastasis to the lymph nodes when the primary orthotopic tumor is shielded.
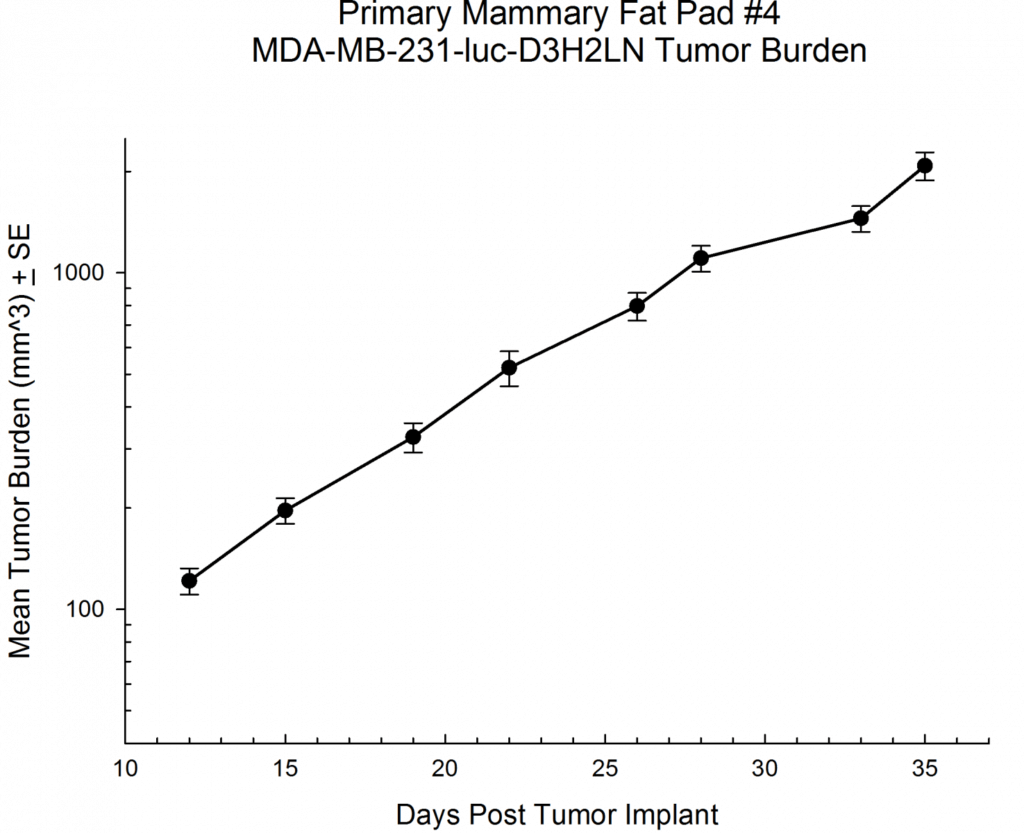
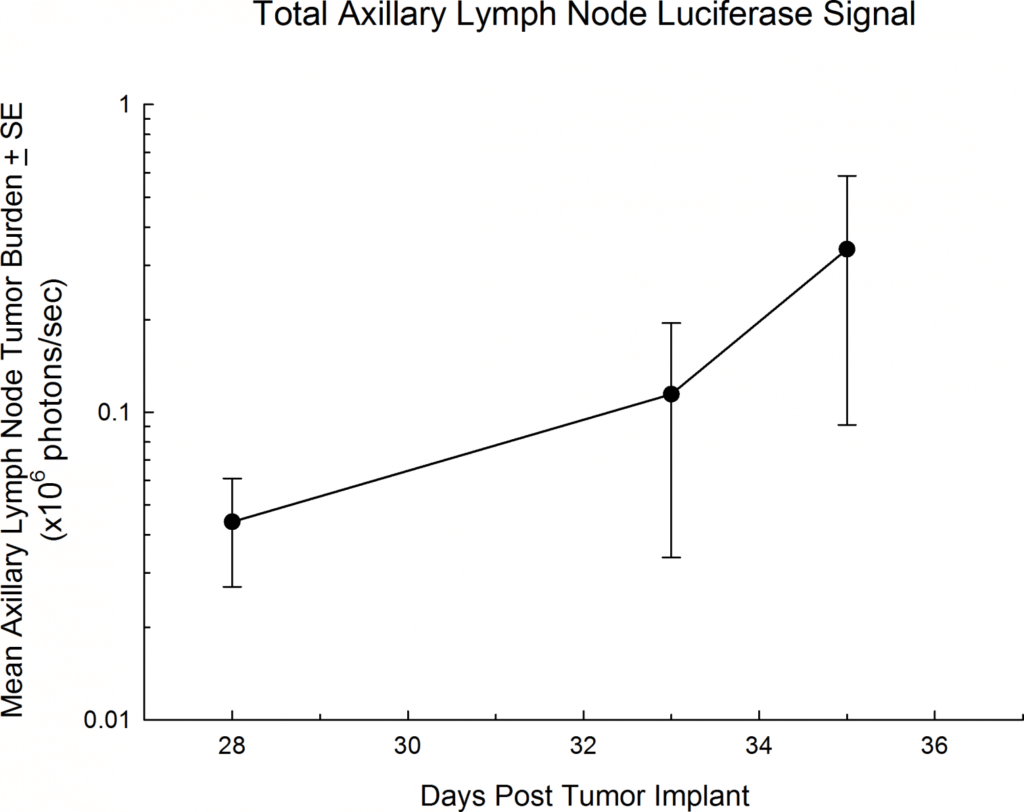
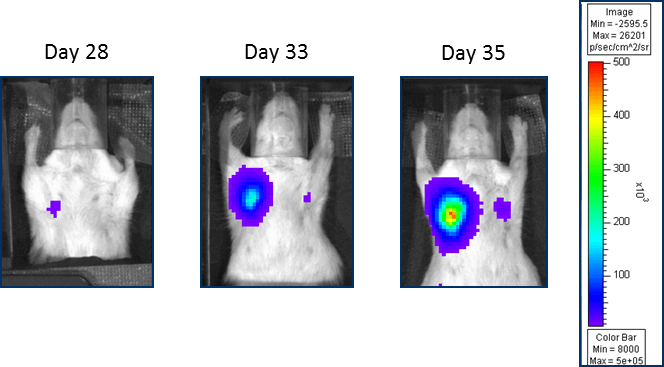
Fig 3: MDA-MB-231-luc-D3H2LN Mammary Fat Pad Orthotopic Implant ? Lymph Nodes
Labcorp has also validated MDA-MB-231-luc-D3H2LN as a metastatic bone model following an intracardiac injection. The MDA-MB-231-luc-D3H2LN cells naturally hone to the bone. Utilizing bioluminescence imaging will ensure that the injections are successful and that treatment groups can be populated with animals displaying equivalent bone tumor burden. This provides a tighter dataset with greater statistical power. Furthermore the ability to monitor disease progression and response to therapy with BLI provides a longitudinal evaluation over the duration of the experiment.
The graphs (Figures 4 and 5) below show the progression of disease and the response to standard of care; along with the matching survival (morbidity/mortality) plot. The BLI images (Figure 6) show the disease progression in the control mice over time.

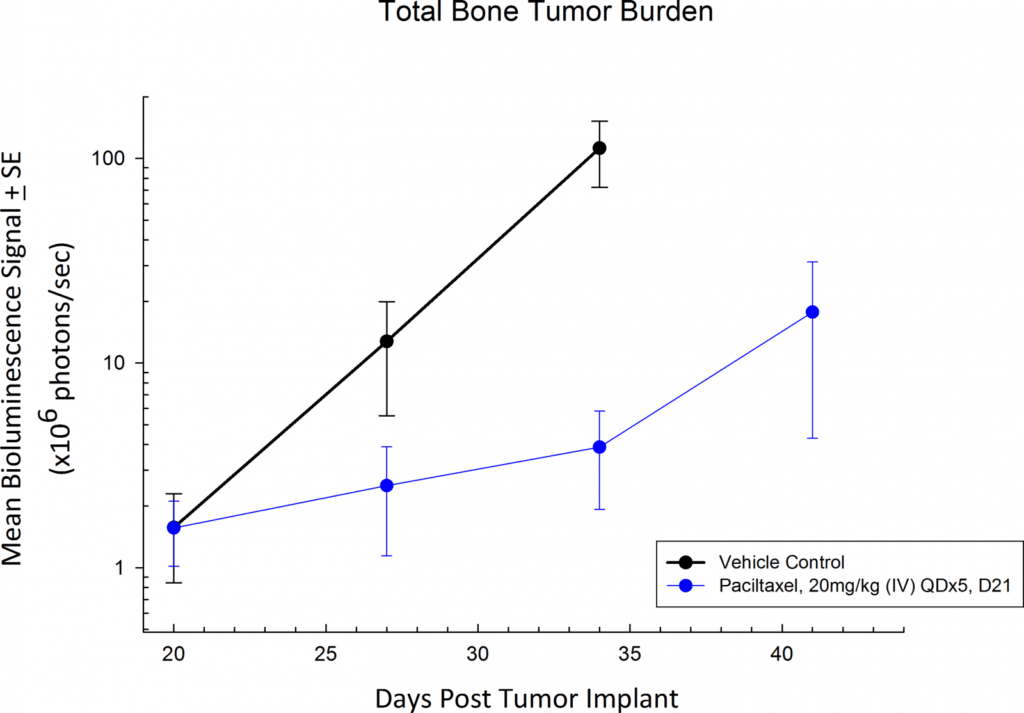
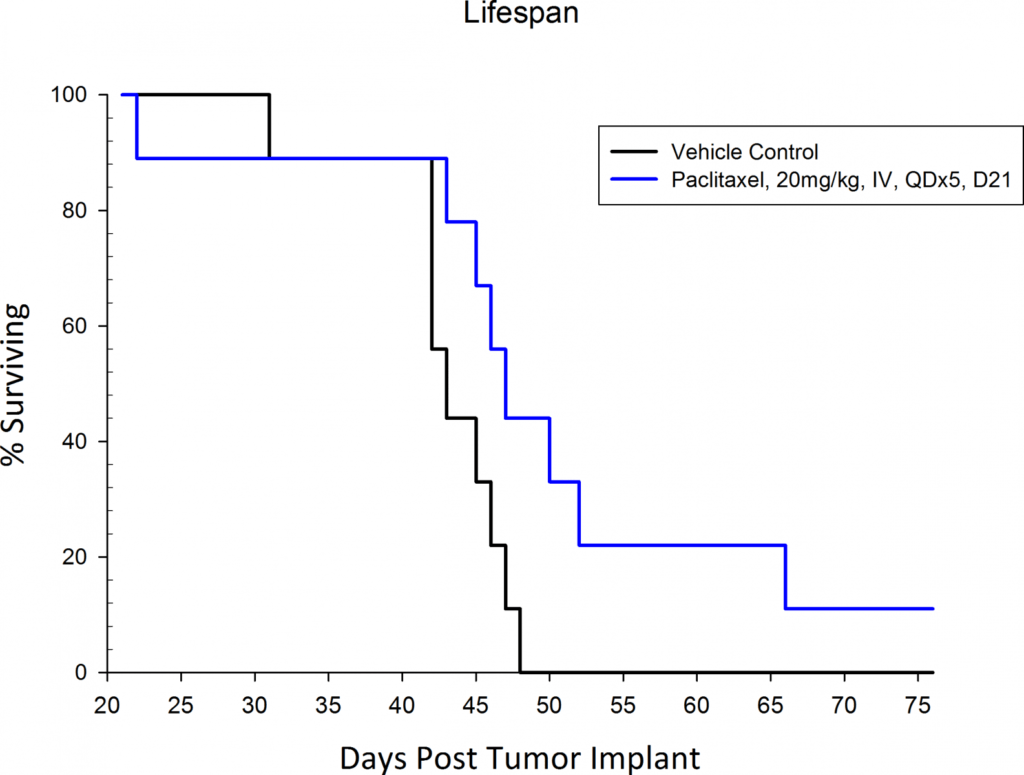
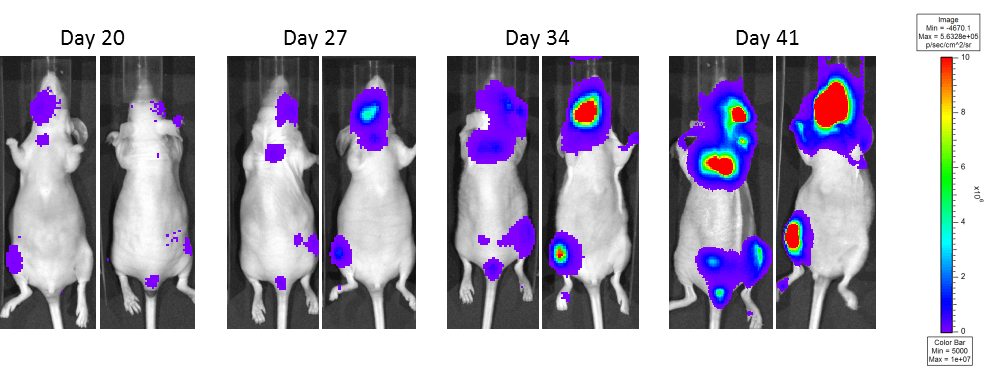
Figure 6: MDA-MB-231-luc-D3H2LN Intracardiac Implantation ? Nude Mice
Please contact us for more information regarding our oncology models or to find out about how Labcorp can help you with your next study.


